The rapid development of information retrieval, computing power and data-storage technologies has enabled Big Data to emerge across a wide range of industrial applications. Its significance lies not only in the volume of information involved, but also in the depth and breadth of the insights that can be extracted from it.

Yet what exactly is Big Data? The term is often used loosely, partly because it lacks a universally accepted formal definition. One useful interpretation describes Big Data as a body of information from which patterns, relationships or insights emerge only when the data are analysed at sufficient scale. Under this definition, Big Data involves more than simply increasing the sample size to obtain a narrower confidence interval around an estimated parameter, as would be expected from a conventional statistical perspective. The concept therefore extends beyond the incremental improvement of existing analytical methods. It suggests that sufficiently large and complex datasets can enable entirely new forms of analysis and discovery. The related term “datafication” has sometimes been introduced to emphasise this broader transformation and to avoid the misleading assumption that Big Data refers only to the physical size of a dataset. Although scale remains an important part of the concept, it captures only part of its meaning. A term such as “Innovative Data” might therefore provide a more intuitive description, although it would arguably be less effective from a marketing perspective. More fundamentally, Big Data is about applying new analytical tools to longstanding problems and examining them from entirely different perspectives. This is precisely why the rise of Big Data has occurred alongside the development of machine learning, which provides many of the methods required to extract structure, meaning and predictive value from increasingly large and complex datasets.
Emerging from what is often described as a strained supervisor–student relationship, the Kolmogorov–Arnold representation theorem is one of the most remarkable mathematical results underlying modern machine learning. It establishes that any continuous multivariate function defined on a bounded domain can be represented through compositions and sums of continuous functions of a single variable. The theorem originated in attempts to address Hilbert’s thirteenth problem, one of the 23 major mathematical problems presented by David Hilbert at the International Congress of Mathematicians in Paris in 1900. Rather than merely resolving the original question, Kolmogorov and Arnold produced a far more general result concerning the representation of multivariate functions. Its underlying ideas later became relevant to the theoretical foundations of neural networks, particularly the study of their ability to approximate complex functions. More recently, the theorem has attracted renewed attention through the development of Kolmogorov–Arnold Networks and the broader rise of deep learning.
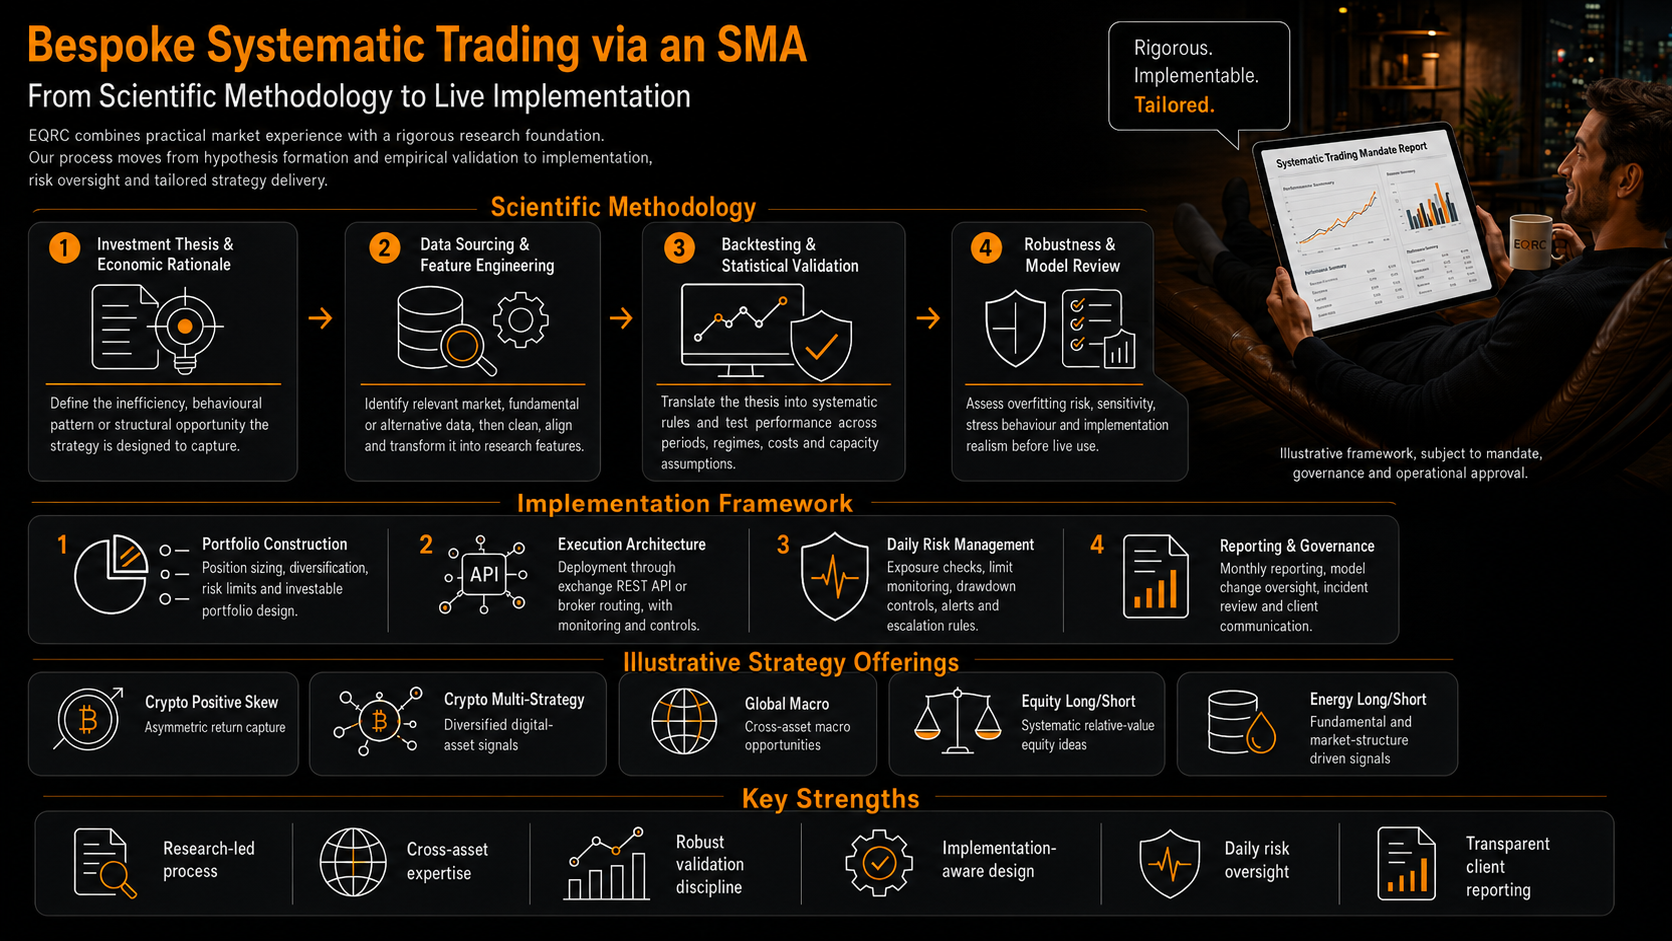
EQRC brings together hands-on trading and portfolio experience with a rigorous theoretical foundation. Our approach is informed by academic research, industry publications, and extensive strategy development across crypto, global macro, equities, and energy markets.

Every backtest should begin with a clearly defined hypothesis, supported by an economic or scientific rationale, all within the ecosystem view of Quantitative Trading. The methodology, investment horizon, data requirements, resource commitment and criteria for success or failure should be established before the results are observed.

The second stage examines whether the data, whether traditional or alternative, are accurate, complete and appropriate for the hypothesis being tested. This includes reviewing data provenance, timestamps, missing observations, proxying and historical revisions, while controlling for potential problems such as survivorship bias and look-ahead bias.

The strategy is then implemented within a realistic historical simulation. Transaction costs, liquidity constraints, market impact and operational assumptions must be incorporated. Out-of-sample testing, sensitivity analysis and stress testing are also required to determine whether the results survive reasonable changes in parameters, data and market conditions.

Finally, the results must be evaluated against the original hypothesis. The central question is not simply whether the backtest produces attractive historical performance, but whether the evidence is sufficiently stable, plausible and statistically credible to distinguish genuine predictive value from chance pattern recognition.
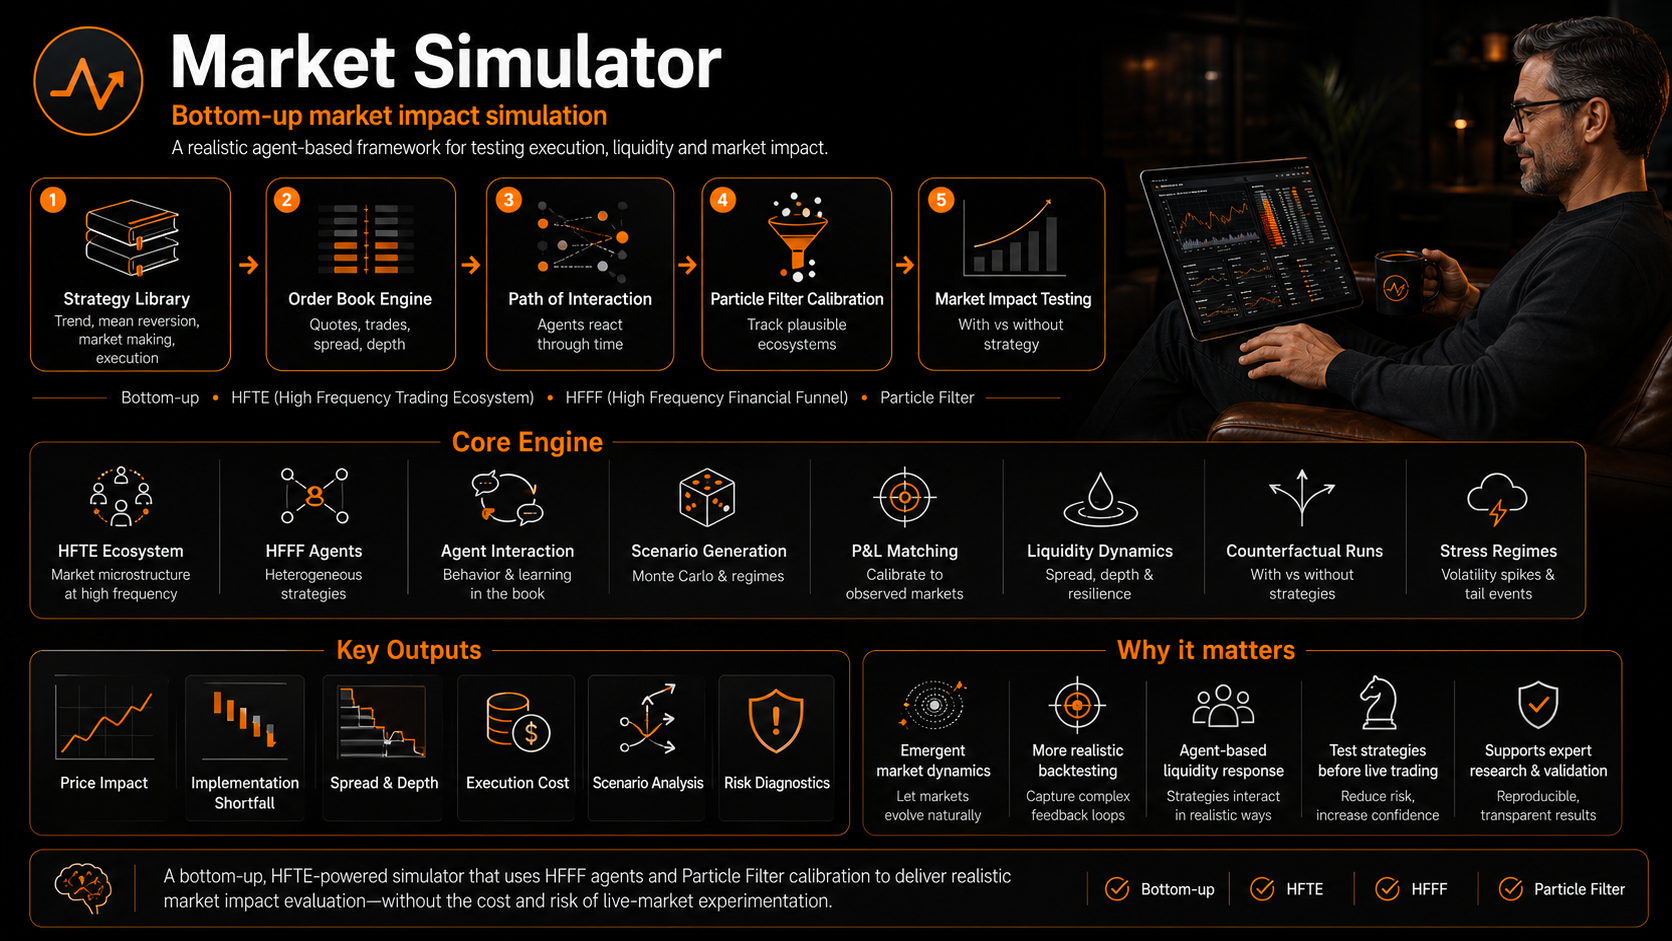
High Frequency Trading Ecosystem: Financial markets can be viewed not only as price processes, but also as ecosystems in which heterogeneous strategies interact, compete and adapt across different frequencies. The principal value of the HFTE framework is therefore conceptual: it encourages researchers and practitioners to consider how the composition and behaviour of market participants may shape price formation, create temporary dislocations and generate new trading hypotheses. Rather than treating the market as an external process to be fitted, the ecosystem perspective interprets market behaviour as the outcome of interacting strategies. The HFTE video on the right introduces this way of thinking. For further detail, download 1 and download 2.
Cointelation: Relationships between assets are rarely equally stable across every observation horizon. By studying the term structure of correlation and introducing the concept of inferred correlation, the Cointelation framework provides a more structured way to examine how dependence evolves across frequencies. This perspective can generate more sophisticated long/short ideas by identifying which relationships are economically meaningful at each horizon. Those ideas can then be translated into proprietary model specifications covering signal frequency, hedge construction, position sizing and risk limits. The Cointelation video on the right presents the underlying framework. For further information download and download 2.